The Challenges:
Enterprise software has become complex over time. Right from monolithic to microservices, from client-server architecture to cloud-based applications, and several other factors contributing to the complexity of the applications. With the rise of complexity in application and infrastructure, testing has evolved as well. From UI-based testing, it has expanded into API, Accessibility, performance, and many more. Even within UI, we have many classifications – Web, Mobile App, and Mobile Web.
Organizations are adopting automated testing to keep up with the volume of testing in addition to manual testing.
Local environments are no longer enough to execute all their tests. Cloud-based on-demand platforms are used to provide infrastructures for parallel test executions.
The different types of testing, different infrastructures, and the range of tools used by the teams make it quite impossible to get the overall picture of testing or the quality of a release or a product in one place.
Testing doesn’t create a product; it validates the quality of the product, and unless we know the results of these tests and understand the root cause of the failure, the goal of testing is not achieved. Testing tools mostly provide a locked-in report format, which doesn’t allow other tools to display their results because of the proprietary nature of the testing tools business.
This causes the testing teams to spend significant time collating the data and reporting it in a manual format to share with their development team and reporting hierarchy.
Let’s look at an analogy, outside of testing , where this type of problem exists – where an organization has to go through several logs to find where the problem lies , there are products like Datadog which have become extremely popular because it has given organizations huge efficiency gains. It is missing in Testing .
The Solution:
At Digy4, we want to solve the problem by building a command center for test reporting. A reporting platform that takes data from multiple sources does several data-related operations and builds visualizations and alerting mechanisms.
To view the holistic picture of quality, we can’t rely solely on the reporting capabilities of the testing tools. To get a holistic picture, you must consolidate multiple data sources – project management, Test management, test framework, and infrastructure. Surely, as the industry becomes more and more complex, newer sets of data will be required to be pulled in.
DigyDashboard consolidates data from multiple sources, normalizes the data, and helps to create meaningful relationships among multiple data points in a format that provides us with actionable metrics.
The best part is it is mostly done through automated processes, and the ground data is accurate without any manual alterations. Unique data extraction and data consolidation capabilities allow our clients to create metrics they have always wished for.
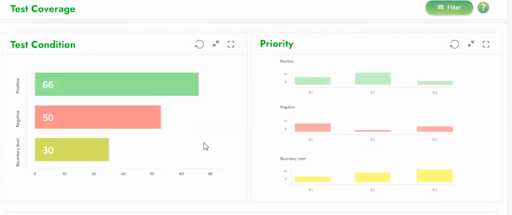
Example – Usually, the conventional test coverage is only shown as the number of test cases that the requirement has. DigyDashboard, for the first time, will allow breaking the data into multiple segments as needed, test conditions, execution mode, and many more. This actionable metric will make decision-making much faster in QA and more data-oriented and authentic.

Test Coverage metrics
Personalization – DigyDashboard will allow users to create personalized dashboards and add metrics as needed. Every level of folks in the organization can create a dashboard catering to their needs. It will allow dashboards to be shared and cloned to scale up collaboration based on the dashboards.
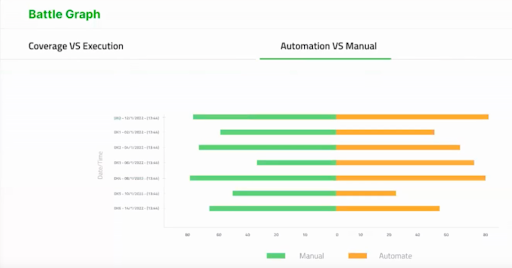
Battle Graph – It is a unique feature we are introducing to the industry. We have always debated how many tests are automated and executed through automation to get insight into the value of automation. Even if some companies capture the data, they mostly use manual processes. DigyDashboard, for the first time, will provide you with the opportunity to directly compare their data in an automated process and understand if your automation is delivering value.

It provides information on how many tests are manual vs. automated so you can identify gaps sitting on the desk without relying on unreliable manual Excel data.
DigyDashboard is your command center for quality and everything you need in terms of data and reporting at your fingertips. Testers can find all the information they need to analyze their test failure in one place – The test Details page.
DigyDashboard – Your own real-time, universally personalized dashboard that is the command center of quality.